A Guide to Trading The EURUSD


Lorem Ipsum
Trading any currency pair has its nuances, some are characteristic of a particular FX pair. While other aspects are more generalized macro factors. Let’s take a look at what drives the EUR/USD and how to trade the forex market’s largest currency pair.
Who trades the EUR/USD?
This is the largest FX pair in the marketplace and involves a varied series of factors. All the main financial institutions such as banks trade the EUR/USD, on a proprietary basis and for their clients. The next biggest slice of the market is taken by mutual funds and hedge funds.
Non-financial institutions make up a small percentage of the market. Most of the trading is done by banks and funds. Importers and exporters are also a big factor driving market volume. However, they do not participate in the market directly and will use brokers and banks to place their trades.
Geographical location is also important, most EUR/USD trades happen within the largest 5 financial centres in the world. These centres include New York, London, Hong Kong, Singapore and Japan. Among these financial centres the lead role for FX goes to London.
What Major factors influence the EUR/USD?
The major factors that influence the price of the EUR/USD are the main macro-economic components related to the countries involved in the FX pair. These factors include:
For the Euro side of the FX pair:
- European Central Bank policy such as monetary tightening, interest rates and money supply
- Employment rates, job creation and unemployment rates
- Budget deficits and national debt ratios of the Euro area
- Gross Domestic Product (GDP) growth in the Eurozone countries
- International and domestic policies
- Eurozone inflation and expectations
For the US dollar side of the FX pair:
- Unemployment rate and job creation, most notably the Non-Farm Payrolls issued monthly
- US GDP growth rate
- Federal Reserve policy such as interest rates, monetary intervention, and money supply
- National budget deficit and debt ratios
- Events in the White House
- Inflation and expectations, the most followed metric is the CPI (Consumer Price Index)
- Trade arrangements and balance of payments
What Price changes in the EUR/USD Mean
Price changes in the EUR/USD reflect a perceived change of balance in one or more of the factors mentioned above. Higher GDP growth rates in one country will cause the currency of that country to appreciate.
If for example, you see the price of EUR/USD increasing over several days it may in part be due to improving economic conditions for the Eurozone. If the price of EUR/USD were to decrease, then the economic conditions in the US may be improving faster relative to the Eurozone.
Higher interest rates in one country, and expectations for interest rates to increase more rapidly on one side than the other, will also lead to price changes. If the perception is that the US will increase interest rates at a faster pace than the Eurozone, you can expect the price of the EUR/USD to decline as the US dollar strengthens.
Reading a EUR/USD Price Chart
The price chart of the EUR/USD is where a trader sees the recent and historical performance of the FX pair. The chart can suggest levels of resistance and support by tracking the most recent price data.
Note that how long these levels are valid depends on the time-frame of the chart. A day chart showing a support level will be valid for several days including weeks. A 1-hour chart showing a support level will only be valid for several hours or a day or two.
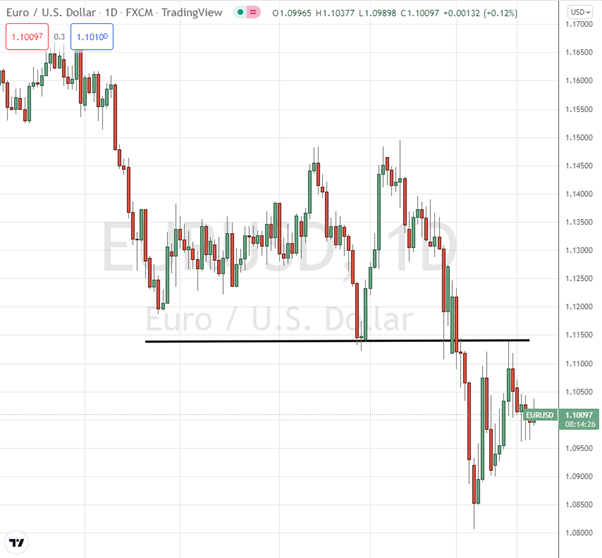
Source: TradingView
The above day chart shows the price action for the EUR/USD. You can see how the support level, black line, was broken. Support lines, once broken act as resistance lines and vice versa. The market then attempted to rally higher but was capped at the new resistance line.
Tips for trading the EUR/USD using Fundamental Analysis
Trading the EUR/USD involves looking at the fundamentals of both currencies’ economies. The good thing about this FX pair is that all the macro data needed is transparent and issued regularly in a timely manner.
To stay on top of the macro-economic data it is essential to use an online economic calendar. These calendars give you updates on the economic data as they are released. This is particularly useful when day-trading, as sudden price movements happen when economic data deviates from the market expectations.
You can also use online platforms that offer historical data, such as TradingEconomics to compare the recent past performance of two countries.
Main Economic factors that are bullish for the US dollar
- US has a faster GDP growth rate
- Job creation is faster in the US
- interest rates are rising faster or expected to rise faster than the Eurozone
The same list is true for the Euro, any of the above factors where the Eurozone outpaces the US will cause the Euro to rally against the US dollar.
Tips for trading the EUR/USD using Technical Analysis
Technical analysis offers a wide array of tools that help traders identify entry and exit points when trading the EUR/USD. Firstly, determine which time frame you will trade on. This factor is important as some technical indicators have little to no value on short time frames such as 1-minute or 5-minute charts.
That said, most technical indicators will have more validity the longer the time frame you are looking at. Let’s say you are day trading and looking at a combination of 5-minute and 30-minute charts. You are more likely to experience the technical indicators you chose failing more often than on a day chart.
So, if you are day trading also check the day chart to make sure that typical patterns indicating price correction or trend breakout have not occurred. A classic example is a two-day candle pattern indicating a top or a bottom may have occurred.
If you haven't checked the day chart you may be taking a position with little chance of success. Patterns and indicators on a day chart have more strength and meaning compared to the same technical indicator on a short time-frame chart.
More Trading Guides :